


1/1/2026
DPP vs. Diabetes Management: Why Your Benefits Strategy Needs Both
Most employer diabetes benefits are designed around one population: the members who already have a T2D diagnosis. The other population, the 96 million Americans living with prediabetes, largely falls outside the benefit design entirely. That is not a gap in the clinical evidence. It is a gap in how benefits portfolios are structured.
The result is a diabetes strategy that catches members at the most expensive point of intervention and misses them entirely at the most recoverable one. NDPP and T2D management programs are not competing benefits. They are sequential interventions for the same population moving along the same disease trajectory. A benefits portfolio that deploys only one is designed for a portion of the diabetes problem, not the whole of it.
Here is how to think about both programs, who each one is designed for, when each one applies, and how to structure eligibility so a member's benefit follows their clinical reality rather than getting stuck at an administrative boundary.
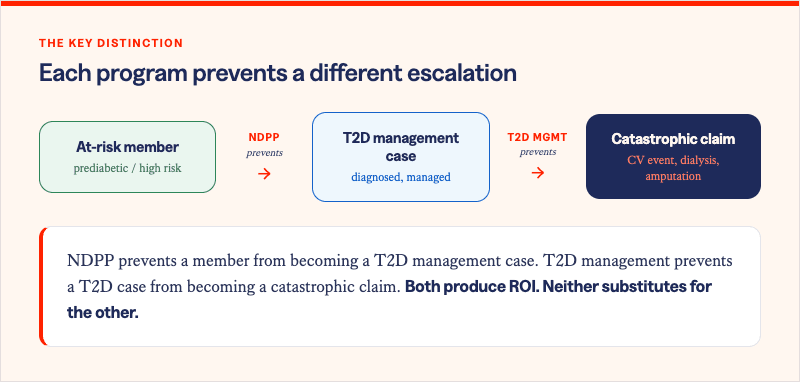
.png)
These two populations are not separate clinical categories. They are the same people at different points on the same disease continuum. A member with an A1C of 6.2% today who does not receive structured intervention has a meaningful probability of crossing the 6.5% diagnostic threshold within five years. Once that threshold is crossed, the program they need changes, the costs they generate change, and the intervention window that could have prevented both has closed.
Viewing NDPP and T2D management as competing line items in a benefits budget misframes the decision entirely. The question is not which program to fund. It is whether your benefits architecture can identify members in both populations, route them to the appropriate program, and keep their benefit aligned with their clinical status as it evolves.
What each program is designed to do
NDPP is a prevention program. Its clinical target is stopping T2D onset before it occurs. The Diabetes Prevention Program Outcomes Study established that lifestyle intervention producing 5-7% body weight loss reduces T2D onset by 58% in high-risk adults -- outperforming metformin, the standard pharmacological intervention, at 31% in the same population. NDPP works because it addresses the metabolic and behavioral drivers of insulin resistance while the physiology is still recoverable. Solera's network data estimates $4,577 in three-year medical savings per obese member aged 41-64 who achieves and sustains that 5% weight loss threshold.
T2D management is a control program. Its clinical targets are A1C reduction, blood pressure control, medication adherence, and comorbidity management. The ROI case for diabetes management is built on what it prevents downstream: the average annual cost of a major cardiovascular event exceeds $50,000. Diabetic kidney disease progressing to dialysis generates costs that can exceed $90,000 per year per member. Lower limb amputation carries an average hospitalization cost above $30,000, with lifetime downstream costs significantly higher. Effective T2D management does not produce a wellness outcome. It produces a prevention of catastrophic claims.
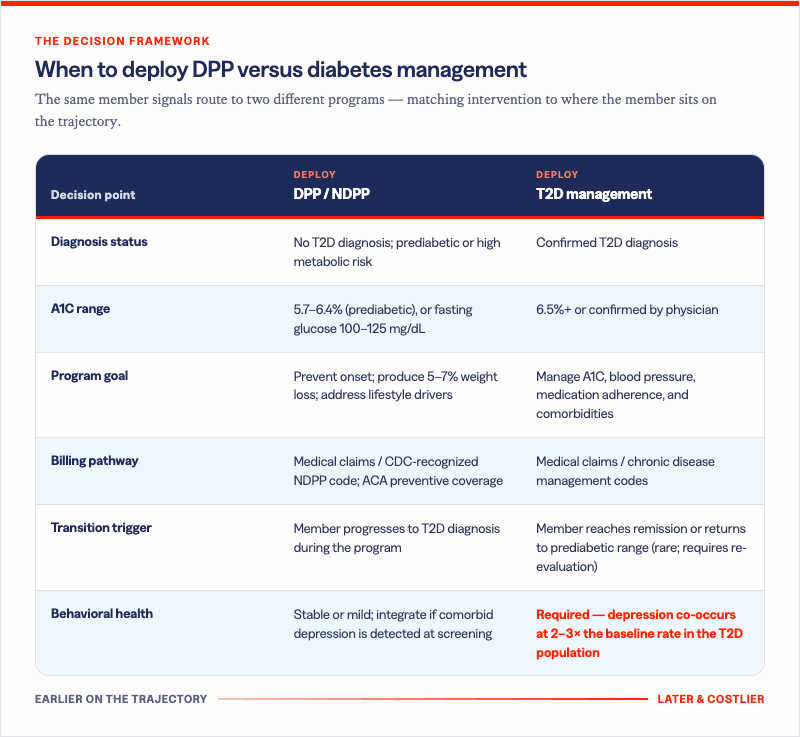
The decision framework: when to deploy each program
The table below maps clinical signals to program deployment. It is a starting framework, not a clinical protocol -- individual member circumstances and physician guidance should inform final routing decisions.
How to structure eligibility for continuity
The most common failure mode in employer diabetes benefits architecture is the eligibility cliff: a member who progresses from prediabetes to T2D loses access to their NDPP program and must navigate a separate enrollment process for a diabetes management program. In practice, many members fall through that gap entirely.
Structuring eligibility for continuity requires three design decisions most benefits leaders have not yet made explicitly.
- First, define the transition trigger. When a member enrolled in an NDPP program receives a T2D diagnosis, what happens? The answer should be automatic routing to a management program, not disenrollment and self-navigation. The clinical moment of diagnosis is exactly when the member most needs a warm handoff, not a benefits gap.
- Second, allow concurrent behavioral health enrollment. Depression co-occurs in T2D members at two to three times the baseline population rate. A diabetes management program that does not screen for and address behavioral health is managing glucose without addressing the condition most likely to undermine medication adherence and care engagement. Both populations benefit from behavioral health integration; the T2D management population requires it.
- Third, measure across the continuum, not just within each program. If your NDPP vendor reports prevention rates and your T2D management vendor reports A1C improvement but neither report connects to the other, you do not have a diabetes strategy. You have two diabetes programs. The measurement framework that matters is how many members who entered NDPP avoided a T2D diagnosis, and of those who progressed, how well their management program controlled cost trajectory.
Explore Other Resources
6/1/2026

The Network Effect: Proving the Value of Curated Digital Health
$1,241 — Total cost of care reduction per member
5/15/2026
Employer Health Care Costs in 2026: What’s Driving the Spike and What’s Actually Working
Do Digital Health Programs Reduce Employer Health Care Costs?
4/6/2026
Death By a Thousand Vendors: A Study of 106 Senior Benefits Leaders
More vendors. More spend. More headcount. And yet — the problem is getting worse.
.png)